Neat Trace Writer Trick
This is one that my colleague Mattias showed me. When I code SharePoint solutions I’m always to put in some diagnostics logging just so that I can turn it on and se what happens. There is (as always) a couple of options here. Write to the ULS logs, which I guess is the preferred way to do it and then use event throttling to turn it on and off. However sometimes its just a bit to much work. So, here’s the trick.
Sprinkle Trace.Writer’s in your code where it makes sense. So for example i might want do put the following code somewhere:
System.Diagnostics.Trace.Write("Feature myAwsomeFeature is installed");Running normally this don’t generate any output. The way I was aware of before to get at this output was to hook up a Trace Listener in the config file.
Now to the trick, at least in my book since I didn’t know about it.
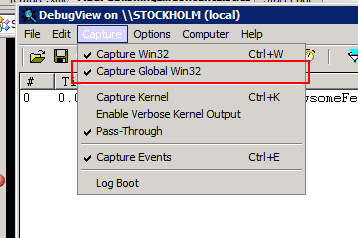
Download DebugView from TechNet. Unpack and fire it up. I had to enable Global Win32 Capturing:
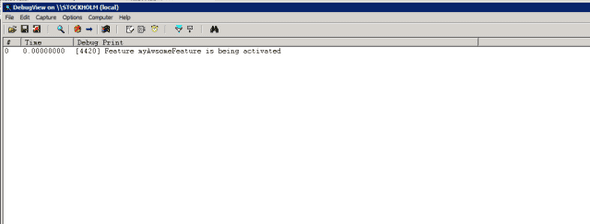
Then it’s just to lean back and watch your eminent Trace Writes roll by:
It’s probably like most things in my life. Everybody else already know about it, but I think it is neat! And by the way, this is of course not tied to SharePoint in any way.
Tags: .NET Development, Computing, Productivity, SharePoint

